Ten listings, six homes: how many rental homes the Netherlands gets
Published on 19 November 202612 min read
Key takeaways
- RentHunter tracked 129,382 rental homes coming onto the free sector in the Netherlands in 2026, about 2,980 a week (RentHunter data, January to October 2026). Treat it as a floor, not the whole market.
- Those homes came from about 207,000 listings. The same property gets advertised on several sites, so roughly ten listings make six homes (RentHunter data, 206,779 listings, same period).
- A quarter were rooms (32,308). Apartments and studios made up 82,984, houses 14,090 (RentHunter data, 2026).
- Amsterdam brought 23,466 homes, about 540 a week, but only about 100 self-contained homes a week asked under €1,500 (RentHunter data and own calculation, 2026).
Table of contents
- How many rental homes come to market in the Netherlands?
- Ten listings, six homes: why counting rental homes is harder than it looks
- How we know the matching isn't fooling itself
- Where the rental homes are
- Why other rental supply figures don't match ours
- What this means for your search
- Frequently asked questions
- Final thoughts
- Sources
You've spotted it. The two-bedroom with the green front door. Monday it was on Pararius. Tuesday an agency site had it, same photos, a price €25 lower. Wednesday a Facebook group posted it again, now "furnished possible". By Thursday you'd saved it three times and felt quite good about how many options you had.
You had one option. Been there.
So how many rental homes actually come onto the market in the Netherlands? Not listings. Homes. We counted it on our own housing data, property by property: ten listings, about six homes. Here's the number, how we got it, and why other supply figures measure something else.
How many rental homes come to market in the Netherlands?
From January to October 2026, we tracked 129,382 rental homes advertised for the first time in the Dutch free sector, about 2,980 a week or 426 a day (RentHunter data). They appeared as about 207,000 listings across about 900 platforms and agencies. Social housing, which sits outside the free sector, and student housing providers are not included.
Here's what the count looks like once the copies are gone:
| Listings after cleaning | 206,779 |
|---|---|
| After photo matching | 152,254 |
| Homes, after attribute matching | 129,382 |
By type of property, over the same period:
| Type | Homes we tracked | Per week |
|---|---|---|
| Rooms | 32,308 | about 740 |
| Apartments and studios | 82,984 | about 1,910 |
| Houses | 14,090 | about 320 |
| All free-sector homes | 129,382 | about 2,980 |
RentHunter data, free-sector homes first seen 1 January to 31 October 2026, duplicates removed.
Compared with the whole housing stock, that's a thin slice. The Netherlands had 1.18 million private rental homes on 1 January 2025, according to CBS, the Dutch statistics office. Most of them aren't empty and waiting. They have tenants on contracts, sometimes for years. What becomes available is the part where a tenant moves out, a new building opens or an owner decides to rent out instead of putting the place up for sale. That part is what you're actually competing for.
We say "homes we tracked" for a reason. We don't see every advert in the country (some private landlords only post in a WhatsApp group or tell a friend), so the real number is higher. Read 129,382 as a floor.
RentHunter listing data from about 900 free-sector platforms and agencies, homes first seen from 1 January to 31 October 2026. Housing corporations, municipal portals, student housing providers, anti-squat and serviced apartments are left out. The same home listed on several sites counts once, prices are medians, and nothing is reported on fewer than 100 listings.
Ten listings, six homes: why counting rental homes is harder than it looks
The same property gets advertised several times, and that's the whole problem. In 2026 our crawlers picked up 206,779 free-sector rental listings once the obvious junk was cleaned out. After we merged the copies, 129,382 homes were left (RentHunter data). That's about 1.6 adverts for every home (own calculation: 206,779 divided by 129,382).
Why so many copies? A landlord signs up with an agency, the agency posts on its own site and on two portals, an aggregator picks it up, someone reposts it in a group. Nobody is doing anything wrong. A count of listings is just a count of adverts.
And that's after the first clean-up. Before it, 338,620 rows came in, and 115,849 of them were pages already offline when we first saw them (RentHunter data, 2026). Mostly re-crawls of places already let, plus a sprinkling of €0 prices and parking spaces filed as apartments. Count those as supply and you'd land on more than two and a half times the real number (own calculation: 338,620 against 129,382). Fun.
Clean the listings
Keep free-sector rentals only. Drop sales, parking, pages already offline when we first see them, and prices or sizes outside realistic bounds.
Merge reposts
The same link posted again within 7 days counts once.
Match photos
Copies on other platforms with near-identical photos, a similar price, size and location, within 14 days, are merged. The agency's own copy is kept where there is one.
Match attributes
Same 4-digit postcode, type and number of rooms, price within 1% and size within 2%, on a different platform, within 14 days: one home.
The last two steps do most of the work. Photo matching takes the 206,779 listings down to 152,254: copies on other platforms with near-identical photos, a similar price, size and location, posted within 14 days. Attribute matching then catches copies that used different photos: same 4-digit postcode area, same type and number of rooms, a price within 1% and a size within 2%, on a different platform, within 14 days. That leaves 129,382 homes (RentHunter data, 2026).
How we know the matching isn't fooling itself
Merging too much is as bad as merging too little. If the rule lumps two different flats together, the count drops and the housing shortage looks worse than it is. So we tested it.
The test works like a placebo. We ran the same rule between neighbouring postcode areas, where any match has to be two different properties, since one flat can't sit in two postcodes. With our tight rule, 24.3% of listings found a match in their own area and only 0.6% in the neighbouring one, so about 97% of the merges are real (RentHunter press data, 12 months to September 2026). A looser rule matched 37.0% against 5.8%, about 84% real. We use the tight one.
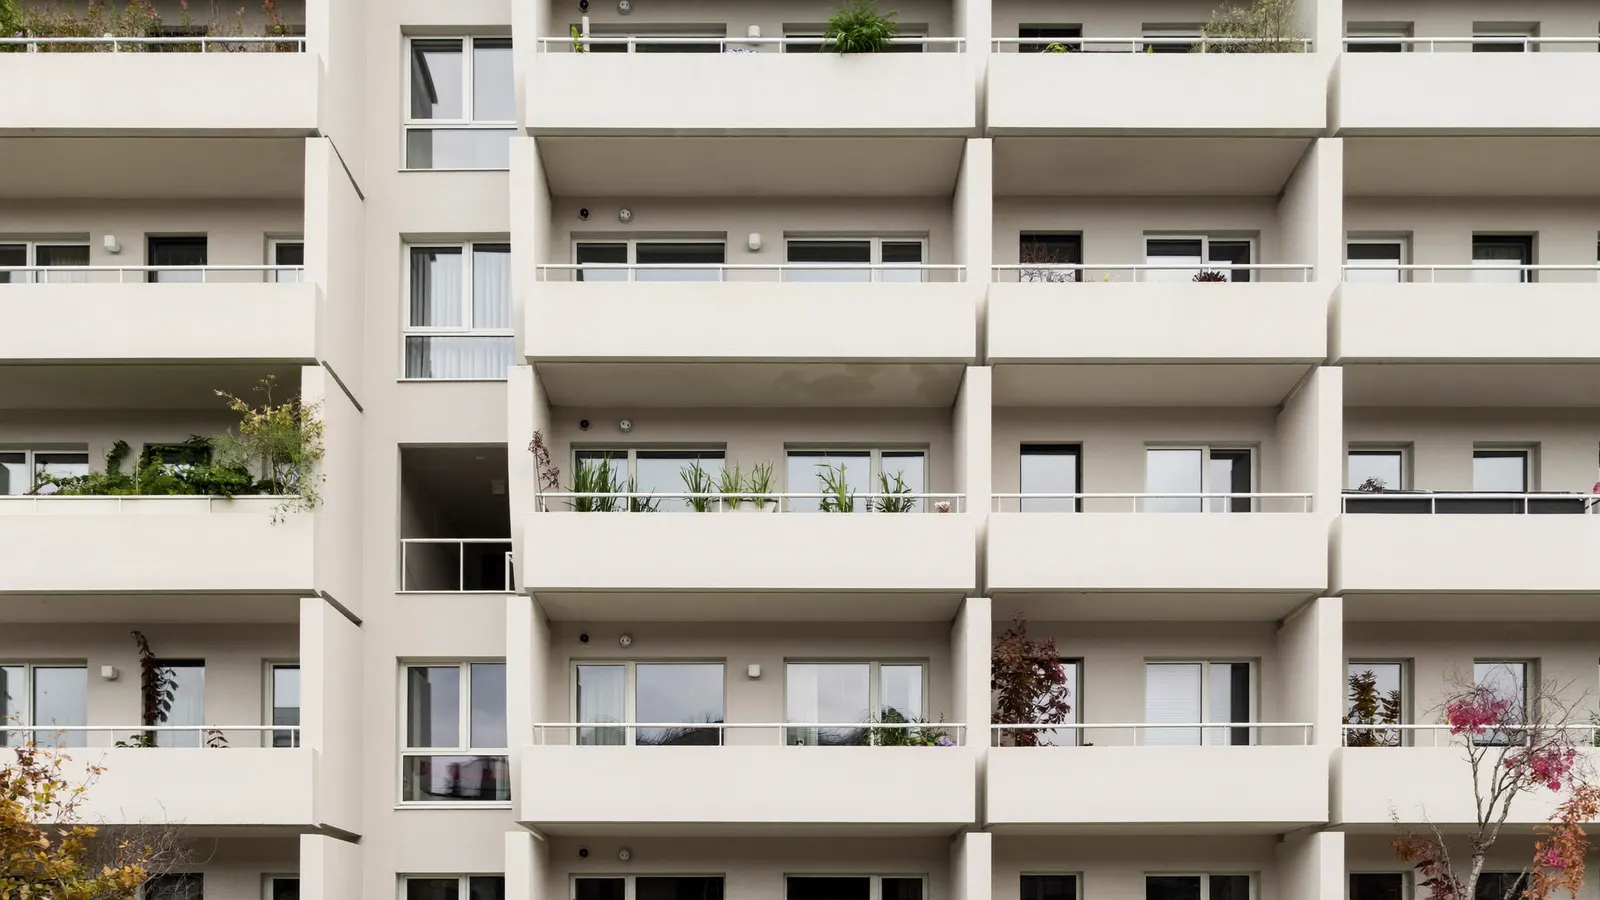 AI-generated illustration. Identical new-build flats are the one thing a careful count still struggles with.
What still fools it: identical new-build units in one complex, each a separate rental property. Same postcode, same size, same rent, genuinely different flats. Full addresses would settle it, but addresses are personal data, so we don't use them for this.
That's also why we give a range over a full year. On the 12 months to September 2026, our central estimate was about 150,100 homes, with a range of 125,100 to 173,700 depending on how strict the matching is (RentHunter press data, October 2026). The method sets the number. A supply figure quoted to the last digit without saying how copies were merged is a count of adverts.
Where the rental homes are
Amsterdam brought 23,466 free-sector homes in 2026, about 540 a week, twice as many as any other city (RentHunter data). After that, the numbers drop fast:
| Amsterdam | 540 |
|---|---|
| Rotterdam | 256 |
| Den Haag | 184 |
| Groningen | 170 |
| Utrecht | 167 |
| Eindhoven | 116 |
Rotterdam had 11,103 homes, Den Haag (The Hague) 7,970, Groningen 7,382, Utrecht 7,266 and Eindhoven 5,036 over the same period (RentHunter data). Groningen is the odd one out: more than half of its homes were rooms (4,205), while every other big city is mostly flats. That's what student demand looks like in a rental market. City counts are less certain than the national total, because one city's platform mix can tilt it, so read them as a ranking.
Now the bit that matters for a budget. In Amsterdam, only 23.3% of self-contained homes asked under €1,500 in 2026 (RentHunter data, 19,494 homes). That's about 100 a week (own calculation: 19,494 x 23.3% over 43.4 weeks), for the whole city, for everyone with that budget. Nationally, 48.9% of self-contained homes asked under €1,500 (RentHunter data, 97,074 homes), so affordable homes are available, just mostly not in Amsterdam, where the asking price of a self-contained home is far higher. Our rent prices in 2026 report has the typical asking rent, city by city.
Why other rental supply figures don't match ours
They usually measure something else, and they're not wrong for it. Three numbers you'll see quoted, all real, all answering different questions:
- Homes let through one platform. Pararius reports that 15,102 homes were rented out through its platform in the third quarter of 2026, 1,585 more than came up for rent there in the same quarter, with new tenants paying an average of €1,914 a month (Vastgoedjournaal, 7 October 2026). That's the flow on Pararius itself, one large portal, quarter by quarter.
- Homes let by member agents. NVM and VGM NL agents rented out almost 2,900 existing free-sector homes in the second quarter of 2026, an increase of 15% on a year earlier (NVM and VGM NL, 30 July 2026). Their tenants paid an average of €19.32 per square metre, an increase of 9.4% on a year earlier. That's signed lets by their members, per quarter. We see roughly that many new homes advertised every week across about 900 platforms, about 38,700 a quarter (own calculation: 2,980 x 13).
- The stock. CBS counts every private rental property, let or not: 1.18 million on 1 January 2025, 3,000 fewer than a year earlier, while private landlords owned 22,000 fewer, mostly sold or otherwise transferred to owner-occupiers.
Listings or homes?
The same home is often advertised on several sites. A count of listings is a count of adverts.
One platform or the whole market?
A portal's own count moves when landlords switch sites, not only when the market changes.
Were new sources added?
Adding sites makes a count jump. Compare only sources covered in both periods.
Are already-let pages removed?
Many crawled pages are already offline when first seen. Counting them inflates supply.
Raw listing counts swing for reasons that have nothing to do with demand or the market. We found that out the hard way. One platform in our own data looked like it had lost 38% of its homes. It hadn't. We'd added agency sites, and its copies of their adverts were now correctly flagged as duplicates. We also added about 1,000 new sources in March 2026, which would make any naive year-on-year count jump higher. That's why you won't see us publish a headline like "supply fell 25%".
What we can say: on the 9 platforms we've crawled every single month since July 2024, the number of self-contained homes in the year to September 2026 was flat compared with the same period a year earlier (RentHunter press data). Flat. Not collapsing, not recovering. Take it as a signal from a stable sample, not as a national trend.
What this means for your search
About 426 new free-sector homes a day sounds like a lot until you split it by city, type and price. A student after a room in Groningen and a family after a house in Eindhoven are each fishing in a small pond, and the pond is spread over about 900 sites. So:
- Count homes, not listings. If one flat shows up four times, you have one lead. Check the photos and the street, and apply where the landlord or their agency posted it first.
- Your budget is the real filter. Affordable homes exist, just not everywhere. In Amsterdam, about 100 self-contained homes a week asked under €1,500 in 2026, while nationally nearly half did (RentHunter data). One city over can change the price, and the maths.
- Watch the copies for differences. A copy with a lower price, a different contact or a request to pay before a viewing is a red flag. Run the photos through a reverse image search, as our scam checklist explains.
- Don't rely on one site. None of them has every available rental property, so keep a few searches running. Our comparison of Dutch rental websites shows which kind of site carries which kind of property.
A listing that copies a real home's photos but asks well under the going rate, or wants a deposit before a viewing, is how a lot of rental scams start. Same photos, different price, different phone number: walk away.
Checking ten sites every morning to find the same six homes gets old fast. RentHunter brings listings from 1,100+ Dutch rental sites into one search, so you stop checking them one by one. It won't make the market any bigger, but it does give you your mornings back.
Frequently asked questions
How many rental homes are there in the Netherlands?
The Netherlands had 1.18 million private rental homes on 1 January 2025, according to CBS, plus the social housing owned by housing corporations. Only a small share becomes available each year: we tracked 129,382 free-sector homes coming onto the market from January to October 2026 (RentHunter data).
How many new rental listings are there per week in the Netherlands?
About 2,980 free-sector homes a week in 2026, once duplicates are merged (RentHunter data, January to October 2026). Counted as raw listings it looks more like 4,760 a week, because the same property is advertised on several sites (own calculation: 206,779 listings over 43.4 weeks).
Why does the same rental property appear on several websites?
Landlords sign up with agencies, agencies post on their own site and on portals, and aggregators and groups copy the advert. In 2026, 206,779 free-sector listings came down to 129,382 homes once we merged the copies (RentHunter data). Roughly ten listings for six homes.
Is the number of rental homes in the Netherlands going down?
The private rental stock shrank slightly in 2024: 3,000 fewer homes, as private landlords owned about 22,000 fewer (CBS). On the 9 platforms we've tracked every month since July 2024, the number of self-contained homes advertised was flat in the year to September 2026 (RentHunter data). A sharp drop in one platform's count can reflect that platform's own stock, or duplicates being merged, rather than the whole market.
Where can I see all rental homes in the Netherlands in one place?
No single portal has them all: the homes we tracked in 2026 were spread over about 900 platforms and agencies. RentHunter brings listings from 1,100+ Dutch rental sites into one search. Set a free alert on RentHunter and new homes that match your budget land in your inbox or the app.
Final thoughts
The Dutch rental market isn't as big as your saved searches make it look, and it isn't as empty as the scariest headlines say. About 2,980 free-sector homes a week came onto it in 2026, out of roughly 1.6 times as many adverts. Count homes, set your budget against the real number in your city, and don't let a busy feed fool you into waiting.
Hit up RentHunter and let the hunt begin. Happy house hunting!
Sources
- RentHunter listing data: central stats file of 2 November 2026 (free-sector homes first seen 1 January to 31 October 2026), a deduplication count run on 10 November 2026 with the same method, and the RentHunter press data methodology of 7 October 2026 (12 months to September 2026: range, placebo test, stable platforms), by the RentHunter Data team. Checked 17 November 2026.
- CBS, "Krimp private huursector in 2024 door minder verhuur door particulieren", 6 October 2025. Checked 17 November 2026.
- NVM and VGM NL, "Belangrijkste huurontwikkelingen 2e kwartaal 2026", 30 July 2026. Checked 17 November 2026.
- Vastgoedjournaal, "Pararius: uitponding verschuift naar duurste huursegment", 7 October 2026, on the Pararius figures for Q3 2026. Checked 17 November 2026.
Free alert
Ten listings, six homes. Set up a free alert and see new homes from 1,100+ rental sites in one search.


Ready to find your perfect home?
Join thousands of expats, students, and professionals who found their home with RentHunter.